 Web Server Statistics for dcsa.kuk.ac.in
Program started on Wed, May 31 2023 at 5:13 PM.
Analyzed requests from Sat, Mar 05 2022 at 6:55 PM to Wed, May 31 2023 at 3:03 PM (451.84 days).
Web Server Statistics for dcsa.kuk.ac.inProgram started on Wed, May 31 2023 at 5:13 PM.
Analyzed requests from Sat, Mar 05 2022 at 6:55 PM to Wed, May 31 2023 at 3:03 PM (451.84 days).
(Go To: Top | General Summary | Monthly Report | Daily Summary | Hourly Summary | Domain Report | Organization Report | Failed Referrer Report | Browser Report | Browser Summary | Operating System Report | Status Code Report | File Size Report | File Type Report | Directory Report | Request Report)
Figures in parentheses refer to the 7-day period ending May 31 2023 at 5:13 PM.
Successful requests: 47 (2)
Successful requests for pages: 31 (2)
Failed requests: 1,069,300 (17)
Redirected requests: 15 (0)
Distinct files requested: 16 (683,573)
Distinct hosts served: 28 (1,606)
Data transferred: 678.81 kilobytes (696 bytes)
Average data transferred per day: 1.50 kilobytes (99 bytes)
(Go To: Top | General Summary | Monthly Report | Daily Summary | Hourly Summary | Domain Report | Organization Report | Failed Referrer Report | Browser Report | Browser Summary | Operating System Report | Status Code Report | File Size Report | File Type Report | Directory Report | Request Report)
Each unit ( ) represents 1 request for a page.
| month | #reqs | #pages | |
|---|---|---|---|
| Mar 2022 | 1 | 1 | |
| Apr 2022 | 0 | 0 | |
| May 2022 | 1 | 1 | |
| Jun 2022 | 7 | 0 | |
| Jul 2022 | 1 | 1 | |
| Aug 2022 | 6 | 2 |  |
| Sep 2022 | 1 | 1 | |
| Oct 2022 | 1 | 1 | |
| Nov 2022 | 1 | 1 | |
| Dec 2022 | 1 | 1 | |
| Jan 2023 | 12 | 7 |  |
| Feb 2023 | 5 | 5 | |
| Mar 2023 | 3 | 3 | |
| Apr 2023 | 2 | 2 | |
| May 2023 | 5 | 5 | |
Busiest month: Jan 2023 (7 requests for pages).
(Go To: Top | General Summary | Monthly Report | Daily Summary | Hourly Summary | Domain Report | Organization Report | Failed Referrer Report | Browser Report | Browser Summary | Operating System Report | Status Code Report | File Size Report | File Type Report | Directory Report | Request Report)
Each unit () represents 1 request for a page.
| day | #reqs | #pages | |
|---|---|---|---|
| Sun | 4 | 4 | |
| Mon | 13 | 6 | |
| Tue | 5 | 5 | |
| Wed | 11 | 2 | |
| Thu | 4 | 4 | |
| Fri | 5 | 5 | |
| Sat | 5 | 5 | |
(Go To: Top | General Summary | Monthly Report | Daily Summary | Hourly Summary | Domain Report | Organization Report | Failed Referrer Report | Browser Report | Browser Summary | Operating System Report | Status Code Report | File Size Report | File Type Report | Directory Report | Request Report)
Each unit () represents 1 request for a page.
| hour | #reqs | #pages | |
|---|---|---|---|
| 0 | 1 | 1 | |
| 1 | 0 | 0 | |
| 2 | 2 | 2 | |
| 3 | 4 | 4 | |
| 4 | 0 | 0 | |
| 5 | 1 | 1 | |
| 6 | 3 | 3 | |
| 7 | 1 | 1 | |
| 8 | 1 | 1 | |
| 9 | 1 | 1 | |
| 10 | 3 | 3 | |
| 11 | 2 | 0 | |
| 12 | 0 | 0 | |
| 13 | 6 | 0 | |
| 14 | 1 | 0 | |
| 15 | 1 | 1 | |
| 16 | 0 | 0 | |
| 17 | 0 | 0 | |
| 18 | 3 | 3 | |
| 19 | 1 | 1 | |
| 20 | 2 | 2 | |
| 21 | 1 | 1 | |
| 22 | 11 | 6 | |
| 23 | 2 | 0 |
(Go To: Top | General Summary | Monthly Report | Daily Summary | Hourly Summary | Domain Report | Organization Report | Failed Referrer Report | Browser Report | Browser Summary | Operating System Report | Status Code Report | File Size Report | File Type Report | Directory Report | Request Report)
Listing domains, sorted by the amount of traffic.
| #reqs | %bytes | domain |
|---|---|---|
| 47 | 100% | [unresolved numerical addresses] |
(Go To: Top | General Summary | Monthly Report | Daily Summary | Hourly Summary | Domain Report | Organization Report | Failed Referrer Report | Browser Report | Browser Summary | Operating System Report | Status Code Report | File Size Report | File Type Report | Directory Report | Request Report)
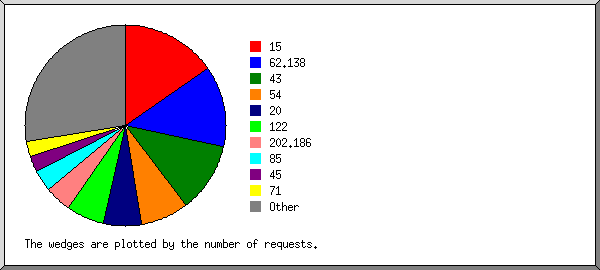
Listing organizations, sorted by the number of requests.
| #reqs | %bytes | organization |
|---|---|---|
| 13 | 0.65% | 43 |
| 9 | 34.48% | 54 |
| 7 | 34.10% | 122 |
| 5 | 25.28% | 202.186 |
| 4 | 0.20% | 20 |
| 3 | 0.15% | 92 |
| 2 | 0.10% | 85 |
| 1 | 0.05% | 208.109 |
| 1 | 4.89% | 27 |
| 1 | 0.05% | 119 |
| 1 | 0.05% | 170.106 |
(Go To: Top | General Summary | Monthly Report | Daily Summary | Hourly Summary | Domain Report | Organization Report | Failed Referrer Report | Browser Report | Browser Summary | Operating System Report | Status Code Report | File Size Report | File Type Report | Directory Report | Request Report)
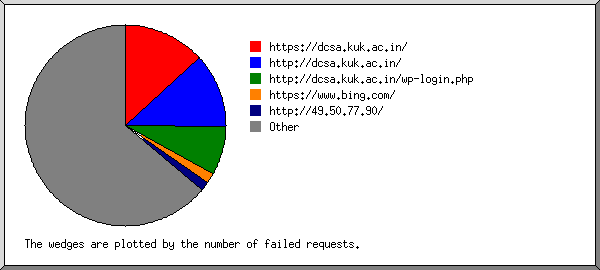
Listing the top 30 referring URLs by the number of failed requests, sorted by the number of failed requests.
(Go To: Top | General Summary | Monthly Report | Daily Summary | Hourly Summary | Domain Report | Organization Report | Failed Referrer Report | Browser Report | Browser Summary | Operating System Report | Status Code Report | File Size Report | File Type Report | Directory Report | Request Report)

Listing browsers with at least 1 request for a page, sorted by the number of requests for pages.
| #reqs | #pages | browser |
|---|---|---|
| 25 | 25 | Mozilla/5.0 (Windows NT 10.0; Win64; x64) AppleWebKit/537.36 (KHTML, like Gecko) Chrome/90.0.4430.85 Safari/537.36 |
| 9 | 4 | Fuzz Faster U Fool v1.5.0-dev |
| 1 | 1 | Mozilla/5.0 (Windows NT 5.1) AppleWebKit/537.36 (KHTML, like Gecko) Chrome/41.0.2224.3 Safari/537.36 |
| 5 | 1 | Mozilla/5.0 (Windows NT 10.0; Win64; x64) AppleWebKit/537.36 (KHTML |
| 7 | 0 | [not listed: 1 browser] |
(Go To: Top | General Summary | Monthly Report | Daily Summary | Hourly Summary | Domain Report | Organization Report | Failed Referrer Report | Browser Report | Browser Summary | Operating System Report | Status Code Report | File Size Report | File Type Report | Directory Report | Request Report)
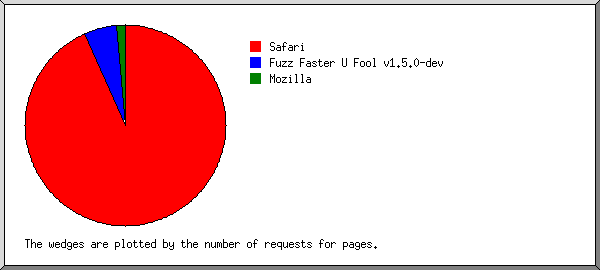
Listing browsers with at least 1 request for a page, sorted by the number of requests for pages.
| # | #reqs | #pages | browser |
|---|---|---|---|
| 1 | 26 | 26 | Safari |
| 26 | 26 | Safari/537 | |
| 2 | 9 | 4 | Fuzz Faster U Fool v1.5.0-dev |
| 3 | 5 | 1 | Mozilla |
| 7 | 0 | [not listed: 1 browser] |
(Go To: Top | General Summary | Monthly Report | Daily Summary | Hourly Summary | Domain Report | Organization Report | Failed Referrer Report | Browser Report | Browser Summary | Operating System Report | Status Code Report | File Size Report | File Type Report | Directory Report | Request Report)
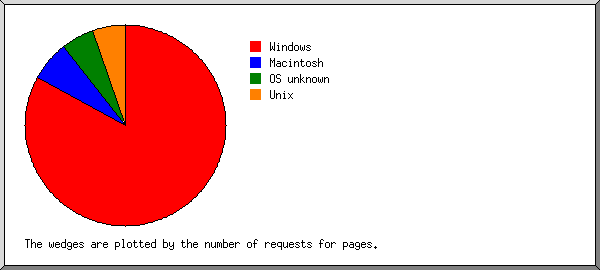
Listing operating systems, sorted by the number of requests for pages.
| # | #reqs | #pages | OS |
|---|---|---|---|
| 1 | 31 | 27 | Windows |
| 30 | 26 | Windows NT | |
| 1 | 1 | Windows XP | |
| 2 | 16 | 4 | OS unknown |
(Go To: Top | General Summary | Monthly Report | Daily Summary | Hourly Summary | Domain Report | Organization Report | Failed Referrer Report | Browser Report | Browser Summary | Operating System Report | Status Code Report | File Size Report | File Type Report | Directory Report | Request Report)

Listing status codes, sorted numerically.
| #reqs | status code |
|---|---|
| 47 | 200 OK |
| 15 | 301 Document moved permanently |
| 1 | 403 Access forbidden |
| 1066879 | 404 Document not found |
| 55 | 4xx [Miscellaneous client/user errors] |
| 2365 | 500 Internal server error |
(Go To: Top | General Summary | Monthly Report | Daily Summary | Hourly Summary | Domain Report | Organization Report | Failed Referrer Report | Browser Report | Browser Summary | Operating System Report | Status Code Report | File Size Report | File Type Report | Directory Report | Request Report)
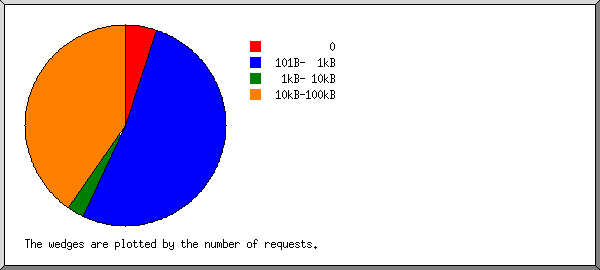
| size | #reqs | %bytes |
|---|---|---|
| 0 | 0 | |
| 1B- 10B | 0 | |
| 11B- 100B | 0 | |
| 101B- 1kB | 26 | 1.30% |
| 1kB- 10kB | 1 | 0.23% |
| 10kB-100kB | 20 | 98.47% |
(Go To: Top | General Summary | Monthly Report | Daily Summary | Hourly Summary | Domain Report | Organization Report | Failed Referrer Report | Browser Report | Browser Summary | Operating System Report | Status Code Report | File Size Report | File Type Report | Directory Report | Request Report)
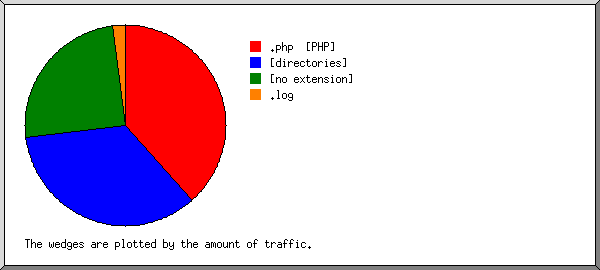
Listing extensions with at least 0.1% of the traffic, sorted by the amount of traffic.
| #reqs | %bytes | extension |
|---|---|---|
| 11 | 48.97% | [no extension] |
| 31 | 25.73% | [directories] |
| 5 | 25.30% | .php [PHP] |
(Go To: Top | General Summary | Monthly Report | Daily Summary | Hourly Summary | Domain Report | Organization Report | Failed Referrer Report | Browser Report | Browser Summary | Operating System Report | Status Code Report | File Size Report | File Type Report | Directory Report | Request Report)
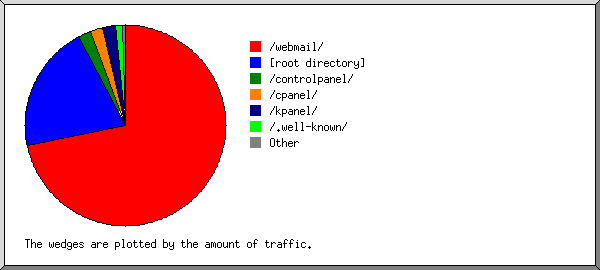
Listing directories with at least 0.01% of the traffic, sorted by the amount of traffic.
| #reqs | %bytes | directory |
|---|---|---|
| 10 | 48.74% | [root directory] |
| 7 | 35.08% | /webmail/ |
| 1 | 4.88% | /controlpanel/ |
| 1 | 4.88% | /cpanel/ |
| 1 | 4.88% | /kpanel/ |
| 25 | 1.25% | /.well-known/ |
| 1 | 0.23% | /mailman/ |
| 1 | 0.05% | /db/ |
(Go To: Top | General Summary | Monthly Report | Daily Summary | Hourly Summary | Domain Report | Organization Report | Failed Referrer Report | Browser Report | Browser Summary | Operating System Report | Status Code Report | File Size Report | File Type Report | Directory Report | Request Report)
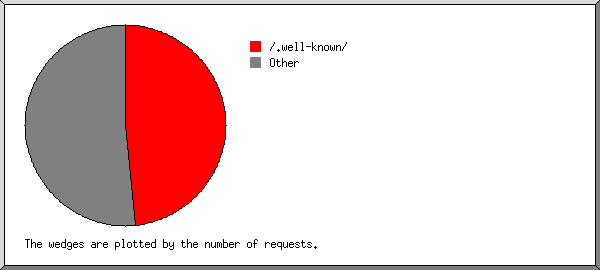
Listing files with at least 20 requests, sorted by the number of requests.
| #reqs | %bytes | last time | file |
|---|---|---|---|
| 25 | 1.25% | May/30/23 3:13 AM | /.well-known/ |
| 22 | 98.75% | Jan/16/23 10:40 PM | [not listed: 13 files] |